
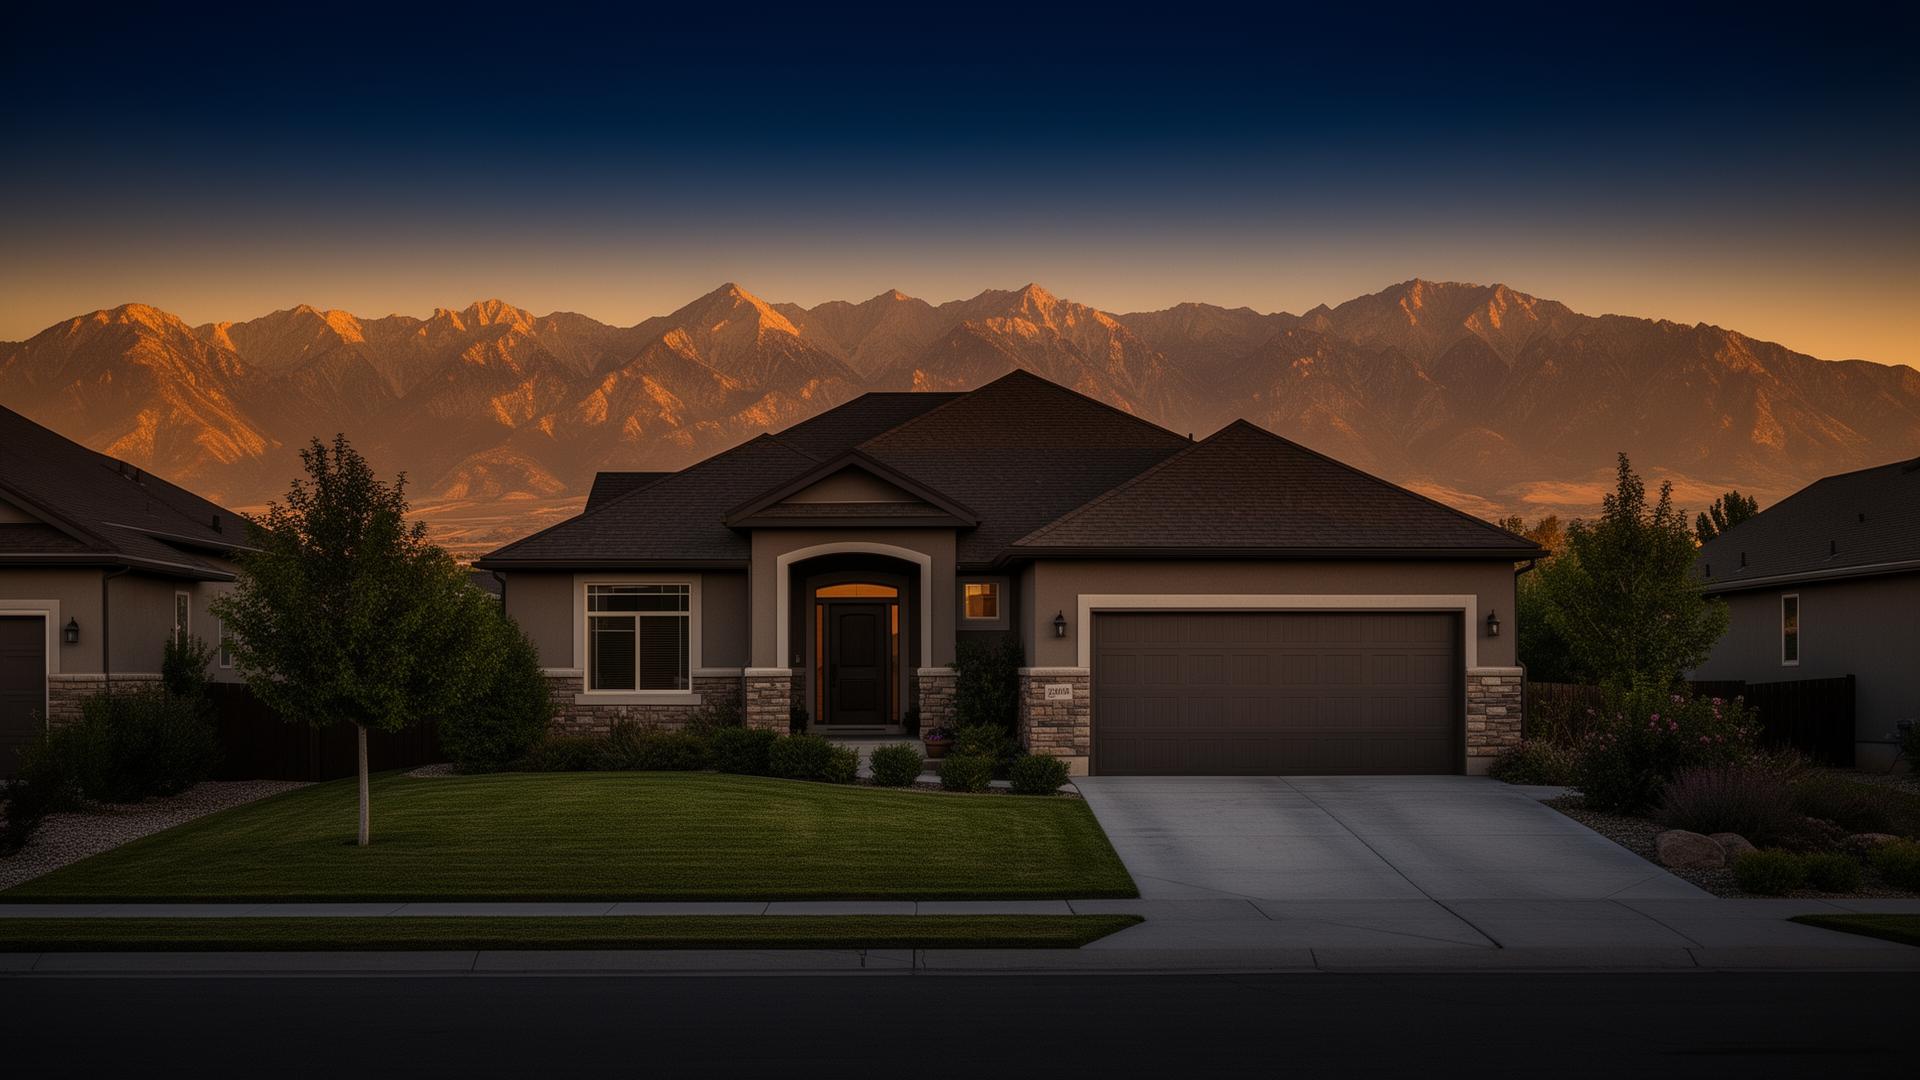
Logan Utah home at golden hour with Wasatch mountains
RE/MAX Peaks

Comparative
Market Analysis

Prepared for 241 Sunstone, Logan, Utah

“A Strategic Pricing & Marketing Plan Designed to Maximize Buyer Demand.”

This analysis combines current Logan market conditions, active competition, recent sold properties, and buyer demand trends to position this property competitively in today's market.

4
Bedrooms
2
Bathrooms
2,262
Square Feet
0.16
Acres
2002
Year Built
2-Car
Garage
Scroll
Subject Property

A Logan home tuned to today's most active buyer band

Address
241 Sunstone
Logan, UT 84321
MLS #
2145760
Property Type
Single Family Residence
Status
Withdrawn
Last List Price
$447,500

This Logan home offers the functional layout, bedroom count, and established neighborhood appeal that today's move-up buyers continue to prioritize. With over 2,200 square feet, a 2-car garage, and family-oriented utility, the property competes directly within one of Logan's most active buyer segments.

Family-Friendly Layout
Bedroom count and flow tuned to move-up buyers
Established Neighborhood
Mature streets with proven resale demand
Functional Floor Plan
Daily-life utility over flashy footprints
Strong Logan Buyer Demand
Sits inside the most active mid-market band
Mid-Market Affordability
Priced where the most buyers can transact
Move-Up Buyer Appeal
First step out of a starter home
Market Analysis & Trends

A balanced Logan market, with pricing accuracy as the deciding factor

At a target price range near $425,000–$450,000, the subject competes in one of Logan's most active and comparison-driven buyer segments. Buyers are prioritizing updated presentation, move-in-ready condition, and value positioning relative to newer construction alternatives.

Buyer Activity
Strong
Inventory
Moderate
Segment
Competitive Mid-Market
Conditions
Balanced → Slight Seller Edge
7-Month Trend
Median list price, mid-market Logan

A steady upward drift in median list price reflects healthy demand, but contracts continue to favor homes priced accurately at launch.

$445Kcurrent median
JunJulAugSepOctNovDec
Absorption & Timing

“Current active and pending inventory suggests buyers remain active in this price bracket, but pricing accuracy and presentation quality significantly impact showing activity and contract timing.”

Sold Comparables

Recent closed sales shaping the value range

Four recent Logan sales that bracket the subject's market position by size, age, and buyer profile.

Sold
$446,000
$209/sqft

948 W 480 N, Logan

3
Beds
2
Baths
2,132
Sqft
20
DOM
Built 2009

One of the strongest comparable sales due to similar size, lot utility, and buyer profile alignment.
Sold
$494,500
$178/sqft

74 Canterbury Dr, Logan

4
Beds
2
Baths
2,781
Sqft
55
DOM
Built 1993

Larger overall utility and lot size support the upper end of the pricing range.

Sold
$358,000
$191/sqft

178 Riverwalk Pkwy, Logan

4
Beds
2
Baths
1,872
Sqft
7
DOM
Built 2005

Smaller living area and overall utility establish a lower market benchmark.

Sold
$363,000
$198/sqft

258 E 550 N, Logan

5
Beds
2
Baths
1,829
Sqft
27
DOM
Built 2000

Demonstrates ongoing buyer price sensitivity below the mid-$400K range.

Active & Pending Competition

What today's buyers are actually comparing this home to

$434,000
Active

1099 Three Point, Logan

4 bd1,703 sqftDOM 343

Acts as a lower pricing anchor and reinforces buyer sensitivity in this segment.

$434,900
Active Under Contract

905 W 540 N, Logan

3 bd1,708 sqftDOM 89

Shows buyers remain active when pricing and presentation align.

$439,000
Active Under Contract

606 Leruisseau, Logan

3 bd1,761 sqftDOM 43

One of the strongest competitive indicators due to similar age, lot utility, and buyer pool.

$425,000
Pending

402 E 1060 N, Logan

4 bd1,867 sqftDOM 11

Fast pending activity reinforces strong demand under the mid-$400K threshold.

Market Signal

“The strongest buyer demand currently appears concentrated between $425,000 and $450,000.”

Pricing Strategy

Three positions. One recommended.

Every pricing tier is built from the comps, the active competition, and how today's Logan buyers behave.

Tier 1

Aggressive Strategy

$425,000 – $435,000

Designed to maximize urgency, showing activity, and early buyer momentum.

  • Fastest market response
  • Multiple-offer potential
  • Strongest showing volume
Recommended
Tier 2

Balanced Strategy

$439,000 – $455,000

The strongest balance between current market support, buyer affordability, and comp-backed positioning.

  • Comp-aligned pricing
  • Strong buyer pool overlap
  • Optimal time-on-market
Tier 3

Premium Strategy

$465,000+

Requires exceptional presentation, upgrades, staging, and emotional buyer appeal.

  • Longer market exposure
  • Demands flawless presentation
  • Narrower buyer pool
Most Competitive Positioning
Mid-$400K Range
$415K$435K$455K$475K
Buyer Profile Marketing Plan

Marketing engineered around who actually buys in this band

01

Move-Up Logan Family

Why they care
Outgrew their starter home and need bedrooms, garage, and a real backyard.
What they compare against
Other 4-bed, 2-bath single-family homes in established Logan neighborhoods.
Emotional angle
Room to grow without leaving the school and community they already love.
RE/MAX Peaks strategy
Lifestyle-led photography, neighborhood storytelling, weekend open house.
02

First-Time Move-Up Buyer

Why they care
Couple or young family stepping up from a townhome or condo.
What they compare against
New-build entry homes vs. established floor plans with more space.
Emotional angle
Pride of ownership in a home that finally feels permanent.
RE/MAX Peaks strategy
Mortgage-clarity messaging, monthly-payment visualizations, evening tours.
03

Utah State / Logan Professional

Why they care
Faculty, medical, or corporate professional relocating into the valley.
What they compare against
Newer-construction comps in surrounding subdivisions.
Emotional angle
Settled, quiet quality of life near work and outdoor recreation.
RE/MAX Peaks strategy
Relocation-targeted digital ads, Zillow Showcase, virtual walkthrough.
04

Investor / Rental-Oriented Buyer

Why they care
Looking for stable cash flow in a steady Logan rental market.
What they compare against
Comparable rentals on rent-per-sqft and cap rate.
Emotional angle
Confidence in a low-vacancy, low-volatility submarket.
RE/MAX Peaks strategy
Numbers-forward marketing, rent comps, investor-network distribution.
The RE/MAX Peaks Advantage

Preparation. Presentation. Position.

Today's market rewards preparation, presentation, and strategic positioning more than ever.

Local Cache Valley Expertise

Boots-on-the-ground knowledge of every Logan submarket.

Premium Digital Marketing

Cinematic listing assets engineered for scroll-stopping reach.

Zillow Showcase Strategy

Top-of-search placement where today's buyers actually look.

Agent Network Exposure

Direct distribution to RE/MAX's active buyer agents.

Social Media Campaigns

Targeted Instagram, Facebook, and TikTok promotion.

Relocation Targeting

Reaching out-of-state buyers moving into Cache Valley.

Buyer Psychology Positioning

Pricing and copy tuned to how buyers actually decide.

Launch Strategy Precision

First-7-days plan engineered to maximize urgency.

Furniture Staging

Professional staging to highlight space, flow, and emotional buyer appeal.

Jennifer Nilson
Your Listing Partner

Jennifer Nilson

Realtor · RE/MAX Peaks

A trusted Cache Valley advisor pairing local market depth with a modern, design-led listing experience — built to maximize attention, urgency, and seller net.

What Clients Say

Recent Google reviews · RE/MAX Peaks

5.0

The RE/MAX Peaks team made the entire process feel easy. Communication was constant, the marketing was sharp, and we sold faster than we expected.

Recent Client

Professional, knowledgeable, and genuinely invested in getting us the best result. We felt like we had a real strategy from day one.

Logan Seller

Hands down the best real estate experience we've had in Cache Valley. Honest advice, beautiful presentation, and a team that follows through.

Cache Valley Buyer
Showing Benchmarks

What well-prepared Logan listings typically see

23
Median showings before contract
91
Average days to contract
130
Average total days to closing

“Well-prepared homes that launch correctly and price competitively often outperform market averages.”

Launch Plan & Next Steps

Eight steps from today to sold

  1. 01

    Final Pricing Strategy

    Lock the launch number with comp-backed conviction.

  2. 02

    Home Prep & Staging

    Light prep, cosmetic refresh, and stage-ready styling.

  3. 03

    Professional Photography

    Twilight, drone, and editorial interior imagery.

  4. 04

    Zillow Showcase Launch

    Premium listing format with priority placement.

  5. 05

    MLS Activation

    Coordinated MLS go-live with maximum-exposure copy.

  6. 06

    Social + Digital Promotion

    Multi-channel paid and organic distribution.

  7. 07

    Open House Weekend

    Concentrated weekend showings to drive urgency.

  8. 08

    Offer Review Strategy

    Negotiation framework to maximize seller net.

Seller Proceeds Calculator

Estimate Your Net Proceeds in Real Time

Adjust pricing, payoff amounts, commissions, and closing costs to explore multiple selling scenarios instantly.

$447,500
5.00% · $22,375
$250,000
$
$0
$
$4,475

Estimated escrow, title, recording, and standard seller closing expenses.

$
$2,400

Auto-estimated for Utah; adjust as needed.

$
$0
$
$0
$
$0
$

Estimated Seller Proceeds
$168,250
Sale Price$447,500
Mortgage Payoff$250,000
Commission$22,375
Closing Costs$4,475
Title Fees$2,400
Estimated Net Proceeds$168,250
Updates instantly as you adjust pricing scenarios.

This seller net sheet is an estimate only and should not be considered exact closing figures. Final settlement statements will vary based on lender requirements, negotiated terms, prorations, title fees, and closing conditions.